Validating System Infrastructure with Pytest

The roles required of a software deployment team generally revolves around the following,

  1. Provisioning the correct app environment
  2. Deploying the correct app version
  3. Configuring the apps, including any data or state they require

The task of provisioning the app environment typically involves spinning up the required number of virtual machines with specific resource configurations, operating systems, network connectivity, block/file/object storage and external services such as databases, directory services, time servers and so on. Ensuring the app environment is setup correctly is a critical necessity, at the same time the manpower resource required to validate the app environment can become non-trivial especially for a large deployment footprint. An automated system validation setup can alleviate some of the pain, if not most.

Pytest for Infrastructure Testing

Pytest is a full-featured Python testing tool that is usually employed for unit and functional testing during the software development phase. Since it is based on Python scripts, Pytest can also be extended to validate the actual state of your deployed servers as part of a production test automation setup.

Installing Pytest & Support Packages on Ubuntu

  • Pre-requisites: Python is probably already installed on your system. Check if you also have pip:
$ which pip

                     or

$ pip –V
  • Run the following command in your command line to install Pytest
$ pip install -U --user pytest

For Python3 compatibility, run the following too

$ pip3 install -U --user pytest
  • You’ll also need the Spur.py Python package to spawn shell commands on remote machines over SSH
$ sudo apt-get install python3-spur
  • If you want to run tests in parallel, you should also install the Pytest-Parallel package
$ pip install -U --user pytest-parallel
$ pip3 install -U --user pytest-parallel

Validating Machines are Online

The network ping function can be used as a basic test to check if a cluster of servers is online. The Pytest script to validate a remote machine (e.g. 192.168.56.101) is online is as follows.

import os

def check_ping(hostname):
response = os.system("ping -c 1 " + hostname)
return response

def test_online():
assert(check_ping("192.168.56.101") == 0)

Save this script as “test_local.py” and launch Pytest,

$ python3 -m pytest -v test_local.py

If the remote target machine is online the expected result is a green pass.

It is trivial to extend the test script to validate the online statuses of multiple machines on the network.

Validating Ping Connectivity on Remote Machines

Usually the test framework is not deployed on the production machines. It is possible to launch Pytest from a dedicated test server (as a Launchpad) to initiate shell commands on remote machines over SSH. The following script checks if an arbitrary website of your choice (www.xyz.com) is reachable from the remote machine at 192.168.56.103.

import spur

def check_remote_ping(hostname):
shell = spur.SshShell(hostname="192.168.56.103", username="test", password="test", missing_host_key=spur.ssh.MissingHostKey.accept)

with shell:
result = shell.run(["ping", "-c 1 -W 2 ", hostname])
if (b', 0% packet loss' in result.output):
return 0 # success
else:
return 1 # fail

def test_remote_online():
assert(check_remote_ping("www.xyz.com") == 0)

If the network connectivity is working correctly on the remote machine the expected result is a pass. If you receive a warning about the crypto function used for the SSH connection, this is likely due to an invalid installation of the cryptography module required by Paramiko, the framework on which Spur is based.

You should be able to fix it by installing the cryptography module,

$ sudo apt-get install build-essential libssl-dev libffi-dev python-dev

followed by,

$ pip install cryptography $ pip3 install cryptography

Running Tests in Parallel

When your number of test cases grows, the test execution time will accumulate as well. The pytest-parallel library allows Pytest scripts to be launched concurrently to achieve a reduction in test execution time.

For instance running pytest in this way allows it to launch the tests with two concurrent threads,

$ python3 -m pytest -v --workers 2

Compare this to running the tests serially,

Auditing Server Configuration, Resource Allocation and More Complex Test Tasks

The Testinfra pytest plugin can be used for scripting more sophisticated tests against the remote server configuration and infra resource allocation.

  • Install the Testinfra plugin as follows,
$ pip install -U --user testinfra
$ pip3 install -U --user testinfra
  • Create a sample testinfra test script (test_infra.py)
def test_passwd_file(host):
    passwd = host.file("/etc/passwd")
    assert passwd.contains("root")
    assert passwd.user == "root"
    assert passwd.group == "root"
    assert passwd.mode == 0o644

and run it.

$ python3 -m pytest -v test_infra.py

If the host isn’t specified, the test is run against the local machine. The expected result:

Spawning testinfra test scripts on remote machines requires a little more configuration involving generating an SSH key pair:

  1. Generate a public-private key pair on the test server
$ cd $HOME/.ssh
$ ssh-keygen -t rsa -f test_server
  • Copy the public key to the target machine
$ scp test_server.pub test@192.168.56.103:/var/tmp/
  • Configure the local ssh config file
$ vi $HOME/.ssh/ssh_config

Enter the following,

Host test_server
  HostName     192.168.56.103
  Port         22
  User         test
  IdentityFile ~/.ssh/test_server

          Save the SSH config file.

  • SSH into the target machine
$ ssh -i $HOME/.ssh/test_server test@192.168.56.103

Import the public key on the target machine

$ mkdir $HOME/.ssh
$ mv /var/tmp/test_server.pub $HOME/.ssh/
$ cd $HOME/.ssh/
$ cat test_server.pub >> authorized_keys
$ chmod 600 authorized_keys
$ rm test_server.pub

Exit ssh and return to the test machine

  • On the test machine, launch pytest against the remote machine over ssh as follows,
$ python3 -m pytest -v --connection=ssh --hosts=test@test_server --ssh-config='/home/test/.ssh/ssh_config' test_infra.py

and the result:

Using Fabric

Fabric is an alternative to testinfra. Some tasks are more easily accomplished on one than the other. Install Fabric as such,

$ pip install -U --user fabric
$ pip3 install -U --user fabric

If you encounter an error prompting, “failed building wheel for fabric”, try this:

$ sudo apt-get install build-essential libssl-dev libffi-dev python-dev

followed by,

$ pip install cryptography
$ pip3 install cryptography

thereafter try re-installing fabric.

Initiating remote SSH connections using Fabric

Here we can reuse the public-private key pair previously generated in the testinfra section.

connect_kwargs = {"key_filename":['PATH/KEY.pem']}

result = Connection(host="192.168.56.103", user="test", connect_kwargs=connect_kwargs).run(‘uname –s’, hide=True)
e.g. connect_kwargs = {"key_filename":['/home/test/.ssh/test_server']}

The following example uses Fabric to audit the amount of free memory and swap space on a remote machine.

from fabric import Connection

# check physical memory
def query_free_memory_percent(remotehost):
  connectinfo = {"key_filename":['/home/test/.ssh/test_server']}
  shell = Connection(host=remotehost, user='test', connect_kwargs=connectinfo)
  result = shell.run('free -m', hide=True)
  lines = result.stdout.split('\n')
  total_m, used_m, free_m, x, y, z = map(int, lines[1].split()[1:])
  mem_free = free_m / total_m * 100
  print ('Free memory (percent): %.0f' % (mem_free))
  return mem_free

def query_free_swap_percent(remotehost):
  connectinfo = {"key_filename":['/home/test/.ssh/test_server']}
  shell = Connection(host=remotehost, user='test', connect_kwargs=connectinfo)
  result = shell.run('free -m', hide=True)
  lines = result.stdout.split('\n')
  total_m, used_m, free_m = map(int, lines[2].split()[1:])
  swap_free = free_m / total_m * 100
  print ('Free swap (percent): %.0f' % (swap_free))
  return swap_free

def test_remote_system_memory():
  assert(query_free_memory_percent('192.168.56.103') > 50)

def test_remote_swap_space():
  assert(query_free_swap_percent("192.168.56.103") > 50)

NOTE:   Execute this in pytest using the ‘-s’ (no capture) option, otherwise a thread exception error could be thrown (“reading from stdin while output is captured”).

$ python3 -m pytest -s -v test_memory.py

Audit System Disk Partition Usage

from fabric import Connection

# check disk utilization
def query_disk_free_percent(remotehost):
  connectinfo = {"key_filename":['/home/test/.ssh/test_server']}
  shell = Connection(host=remotehost, user='test', connect_kwargs=connectinfo)
  result = shell.run("df -h / | tail -n1 | awk '{print $5}'", hide=True)
  diskfree = result.stdout.strip()
  print ("Disk free = " + diskfree)
  return int(''.join(c for c in diskfree if c.isdigit()))

def test_remote_disk_free():
  TestGroup = ['192.168.56.103']
  for svr in TestGroup:
    assert(query_disk_free_percent(svr) > 10)

Validate Time Synchronization

from fabric import Connection

# check ntp service
def check_ntp_enabled(remotehost):
  connectinfo = {"key_filename":['/home/test/.ssh/test_server']}
  shell = Connection(host=remotehost, user='test', connect_kwargs=connectinfo)
  is_active_result = shell.run("systemctl is-active systemd-timesyncd.service", hide=True)
  is_enabled_result = shell.run("systemctl is-enabled systemd-timesyncd.service", hide=True)
  return is_active_result.stdout.strip() == 'active' and is_enabled_result.stdout.strip() == 'enabled'

def check_time_sync(remotehost):
  connectinfo = {"key_filename":['/home/test/.ssh/test_server']}
  shell = Connection(host=remotehost, user='test', connect_kwargs=connectinfo)
  result = shell.run("timedatectl", hide=True)
  lines = result.stdout.split('\n')
  networkTimeOn = False
  ntpSynced = False

  for line in lines:
    if 'Network time on:' in line:
      status = line.split(':')
      if status[1].strip() == 'yes':
        networkTimeOn = True
    elif 'NTP synchronized:' in line:
      status = line.split(':')
      if status[1].strip() == 'yes':
        ntpSynced = True
  return networkTimeOn and ntpSynced

def test_time_synchronization():
  TestGroup = ['192.168.56.103']
  for remotemachine in TestGroup:
    assert(check_ntp_enabled(remotemachine) == True)
    assert(check_time_sync(remotemachine) == True)

Summary

This article just touches the surface to show how pytest can be used as a test automation framework to perform system validation against a large system infrastructure deployment. All test scripts are in plain text and can therefore be readily version-controlled in Git or Subversion. In fact the pytest scripts can be integrated and launched from CI/CD platforms such as Gitlab, therefore allowing combining configuration management and test automation into a single platform.

An IP Camera Emulator

The IP Camera Emulator is an open source Windows .NET app that can emulate one or more RTSP video cameras from video files. It does this by automatically looping the video file playback to emulate a continuous live video feed. 

This software tool was created to aid load testing of video management software and CCTV network video recorders without requiring to set up a cluster of real IP surveillance cameras. It makes use of VLC libraries to generate RTSP video streams from video files. You can download the prebuilt Win32 binaries from here or built it from source. Note the software requires these VLC library components (32-bit editions) in the application folder:
  • libvlc.dll
  • libvlccore.dll
  • the “plugins” folder
The library components from VLC version 2.2.6 and 1.1.9 seem to work well. I had more successes with Ver 1.1.9.

The app requires .Net Framework 4 or higher and a valid network connection. App settings are maintained in C:\ProgramData\IpCameraEmulator\ and read/write access to this folder is required (in most cases the default permission should already be r/w). At the moment the app is only available in 32-bit edition and you can run it on both 32-bit and 64-bit Windows workstation (tested on Win7 and Win10) and server OSes (tested on WS2012).

A Simple Use Case

In this simple use case illustration, the IP Camera Emulator was used to generate eight virtual H.264 camera streams for ingestion into Milestone XProtect VMS.

IP Camera Emulator app running on Machine A
Milestone XProtect Management Client on Machine B
Milestone XProtect Smart Client on Machine B

Using the IP Camera Emulator

Launch IpCameraEmulatorStd.exe to start the app. When run for the first time, the app launches with no emulation channels.

Click ‘Add’ to create a channel.

Field Name    Mandatory Field?Must be Unique?           Description                                                                      
Channel NameNoNoProvide an appropriate name for this emulator channel. If this field is not specified, the app assigns the default name, “Channel”
Video FileYesNoSpecify the file path of the video clip to be used to generate the video streams for this channel. You may use the “…” button to choose a file with the Open File Dialog. The app accepts AVI, MP4 and M4V video file containers.
RTSP PortYesYesSpecify the RTSP port number for video streaming. Each emulator channel on the same machine must be assigned a unique port number.
EnabledNoNoState whether the app shall stream this channel (enabled) or not (uncheck this selection) when the emulator engine is started.
Batch AdditionNoNoYou can perform a batch addition of up to 10 channels. The app will auto-increment the RTSP port for each new channel.

With at least one emulator channel created, you can start the video stream emulation.

Click the “Start” toolbar button to initiate the video stream emulation. The channel status should transit to “Streaming”.

At this point you should be able to connect to the RTSP streams either on the local machine or from a remote machine. The RTSP url of each channel takes on the following format:

      rtsp://<IP address of machine>:<RTSPport>/

For instance, in the above example and screenshot, “rtsp://localhost:8556/”, “rtsp://127.0.0.1:8556” or “rtsp://192.168.20.218:8556/” are valid RTSP urls of Channel 3, depending where you are connecting from. You can use VLC to connect to the RTSP streams.
“netstat -an” shows the expected ports in listening mode, ready for connection from RTSP clients.

A note about the preferred video codec type

The IP Camera Emulator app uses VLC libraries to generate the RTSP video streams without applying any transcoding, meaning the original video frames embedded in the video file are sent as-is. For this reason, H.264 video clips are generally more efficient candidates for video stream emulation in terms of network bandwidth utilization. Besides, the app consumes quite little CPU resources without the transcoding.

VLC provides a hint of the embedded video codec/format via the Tools > Codec Information dialog.

RTSP Streaming to Milestone XProtect VMS

Milestone XProtect accepts RTSP video streams via its Universal Driver (more details here). However the recent XProtect and Device Pack releases do not seem to cooperate as well with VLC-generated RTSP streams compared to the older releases, so you may encounter problems trying to get the RTSP streams to show up on the Milestone Management Client as I did, especially if the RTSP source is on a different machine than the Milestone XProtect installation. From several Milestone support forum threads it seems other folks face the same issue too (Thread 1, Thread 2, Thread 3).

Using Wireshark it could be observed Milestone XProtect was initially able to establish the usual RTCP negotiation session with the VLC streaming source and RTP streaming actually started. Somehow Milestone maybe “dislikes” the received RTP packets and subsequently issues a TEARDOWN which stops the video streaming abruptly. As a result Milestone Management Client indicated the channel stays disconnected. On the other hand VLC was able to receive and render the RTSP streams normally. More interestingly (or frustratingly), Milestone was able to receive locally-generated RTSP streams but failed if the RTSP streams came from a remote machine.

After some stabbing in the dark and with a stroke of luck, turning off the local Windows Firewall on the Milestone server eventually resolved the remote streaming issue for me; YMMV. VLC was able to playback the remote RTSP stream without requiring turning off the local Windows Firewall so what is happening inside Milestone XProtect is baffling.

Using the Milestone Universal Driver to Ingest RTSP Video Streams

Milestone XProtect comes with a Universal driver for ingesting RTSP media streams from generic network cameras. There is a knowledge base article that describes how to configure and use it. This also works for the software-based RTSP camera emulation recipe described in a previous post which you can use to test live view and recording on Milestone XProtect VMS even without real network cameras. The specific settings to configure on Milestone are described here.

The Steps

  1. Use VLC Player to verify the emulated RTSP video stream can be received and rendered if you have not already done so.
  2. In Milestone Management Client, right-click a recording server and select “Add Hardware…”
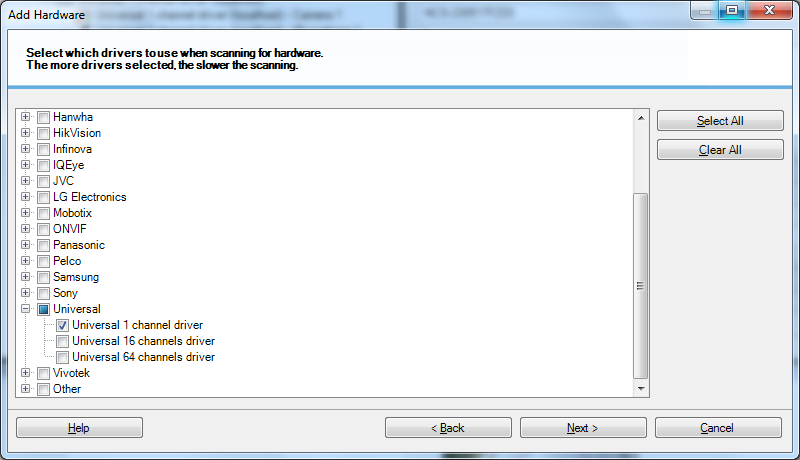
  3. Choose the Manual mode, click Next. Click Next again to arrive at the driver selection page. Clear all selections and select Universal | Universal 1 channel driver. Click Next.
    Add Hardware 0.1
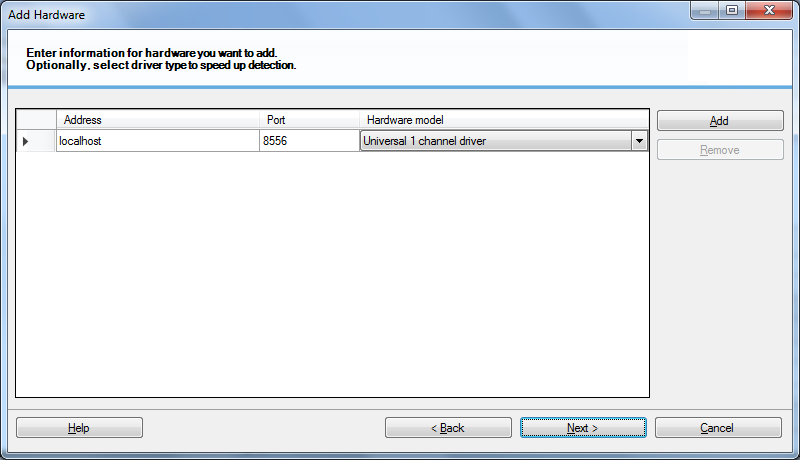
  4. Specify the connection details. Enter the RTSP port number in place of the default Port 80. Explicitly select the Universal 1 channel driver too. Click Next.Add Hardware 01
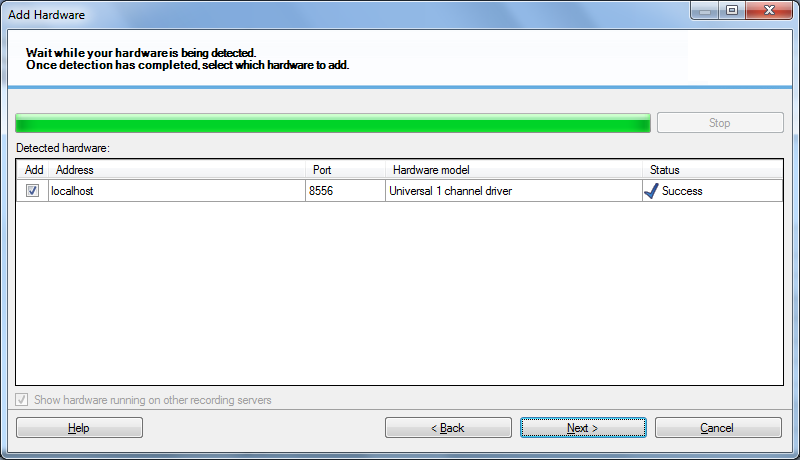
  5. Verify the “hardware” can be detected. Click Next and verify you have another “Success”. Click Next twice.Add Hardware 02.png
  6. Finally specify the default Camera Group. You may have to create one the first time. Click Finish and verify the Universal 1 channel driver device is successfully added to the recording server.
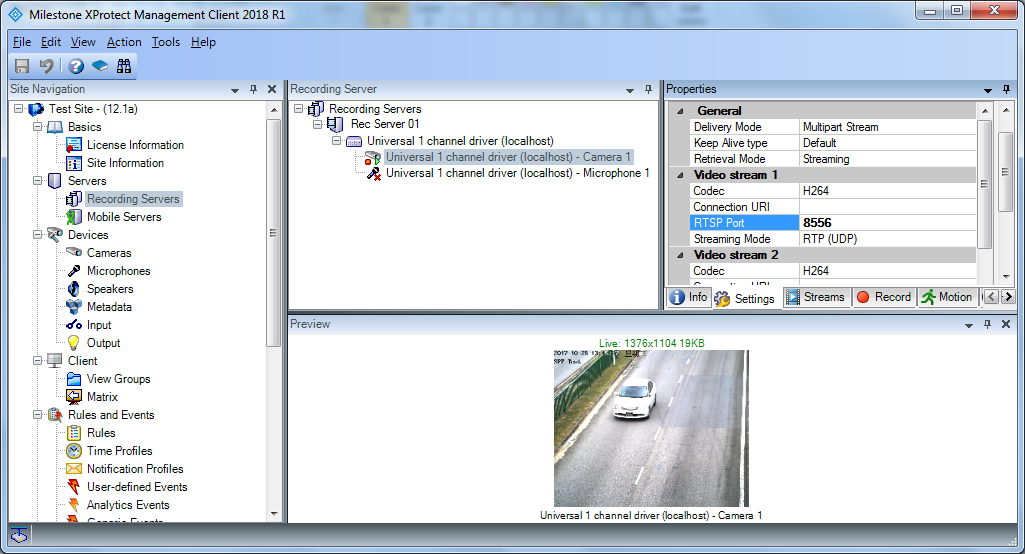
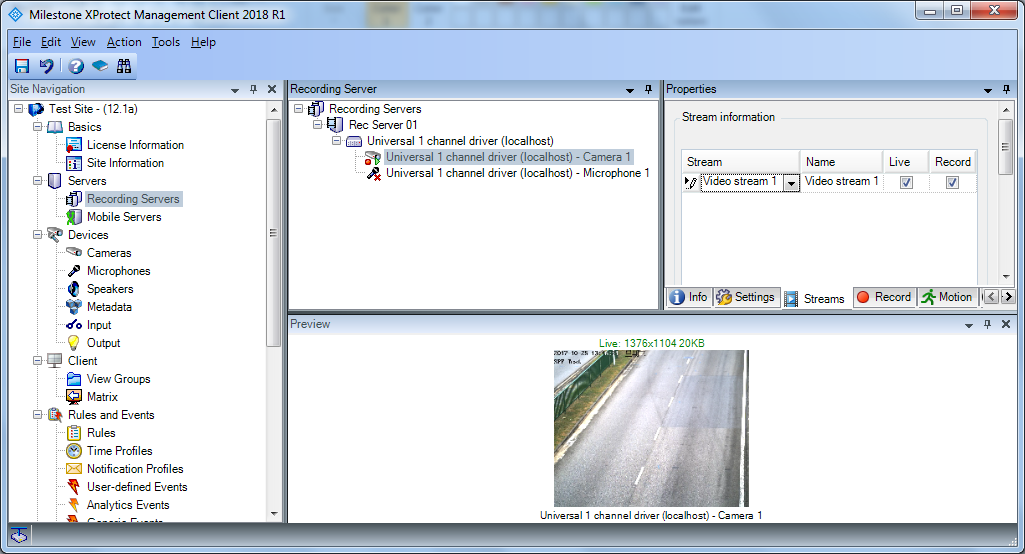
  7. Expand the newly-added device tree node and select the “Universal 1 channel driver (localhost) – Camera 1” child node. Select the Settings tab in the Properties Pane. Assuming the RTSP URL of your emulated stream is “rtsp://localhost:8556/”, you need to configure “Video stream 1” in the Properties Pane as follows,
    • Codec:    H264
    • Connection URI:    — null entry —
    • RTSP Port:    8556
    • Streaming Mode:    RTP (UDP)
  8. Save the settings. After a short interval (around 5 seconds) Milestone should connect to the RTSP video stream successfully.Add Hardware 03.png
  9. If at first Milestone does not connect to the RTSP stream, select the Streams tab and verify Video stream 1 is selected for “Live” and (optionally) “Record”. If you modify any settings you need to click the Save toolbar button (below the File menu item) to apply them.Add Hardware 04

You can ingest more than one emulated RTSP video streams into Milestone XProtect VMS by repeating the above steps, as long as the following TCP/IP fundamentals are adhered to,

  • Each RTSP stream originating from the same machine must use a unique RTSP port number
  • RTSP streams originating from different machines (and hence different IP addresses) may use the same RTSP port number


RTSP Streaming a Video File

Almost all IP surveillance cameras are capable of streaming in RTSP nowadays, and video surveillance recording endpoints (NVRs and Video Management Systems) invariably accept the RTSP streaming format as well. Sometimes it can be a hassle to set up a real IP camera just to test video streaming to NVRs and VMSs, so emulating an IP camera using off-the-shelf software comes in handy in those situations. One of those software utilities is VLC; this post describes the steps for VLC running on Windows.

The GUI Way

1.       In VLC Player, select Media | Stream.

vlc01

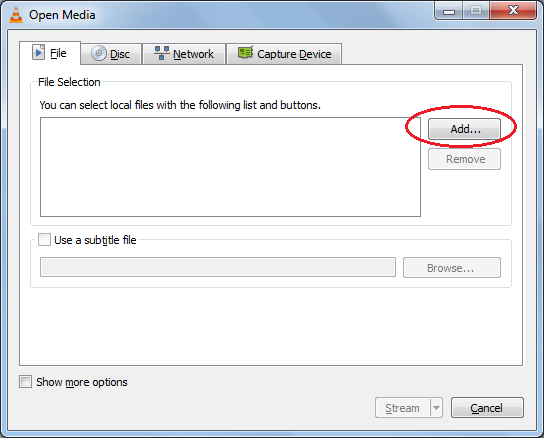
 2.       Click “Add…” to select the video file. Click “Stream”.

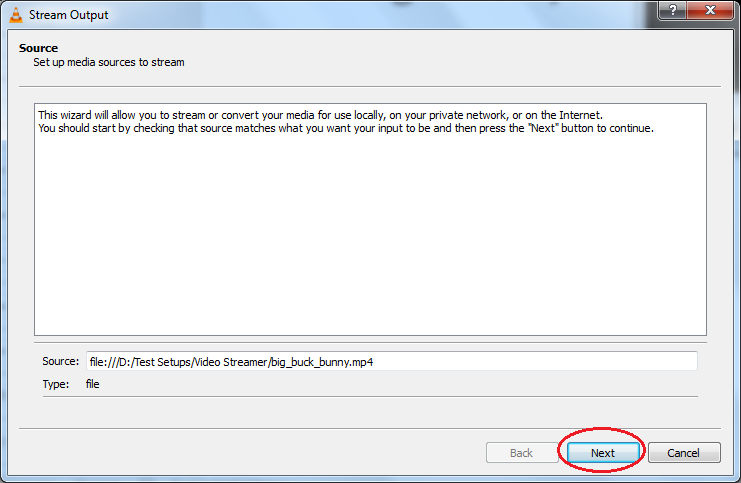
3.       Click Next

vlc02

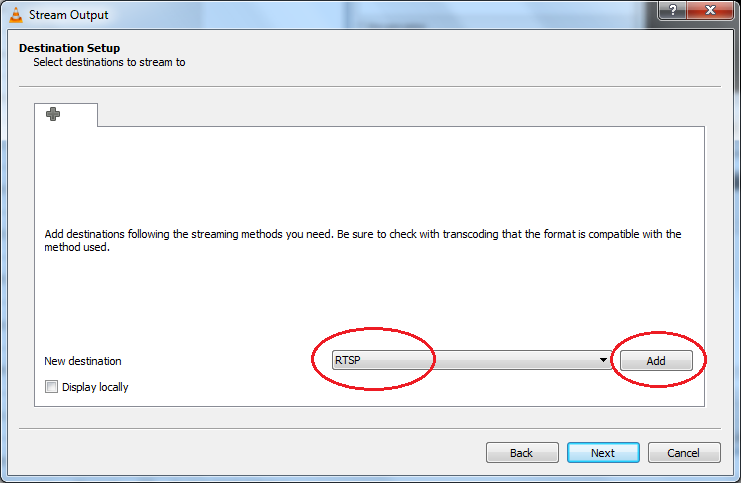
4.       Select “RTSP” from the dropdown list and click “Add” to select a video file. To avoid the need for transcoding (which consumes more CPU), try to select video clips encoded in H.264. Click Next.

vlc03

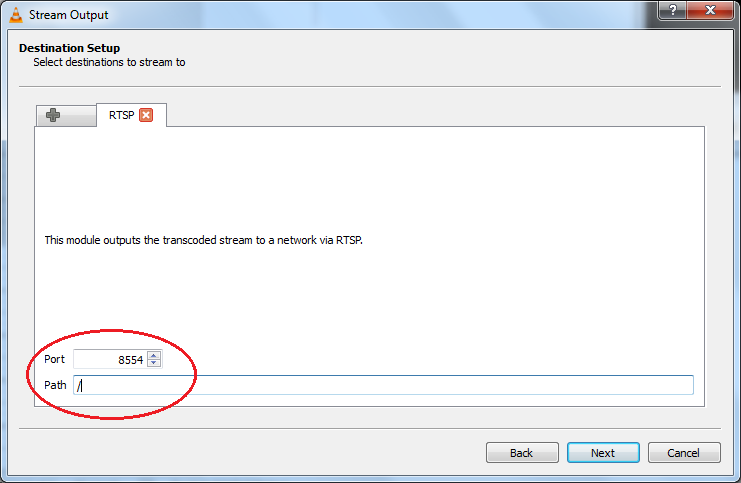
5.       You may specify the RTSP port and URI. Both are optional. With the default settings, the RTSP URL will be “rtsp://localhost:8554/”. Click Next.

vlc04 

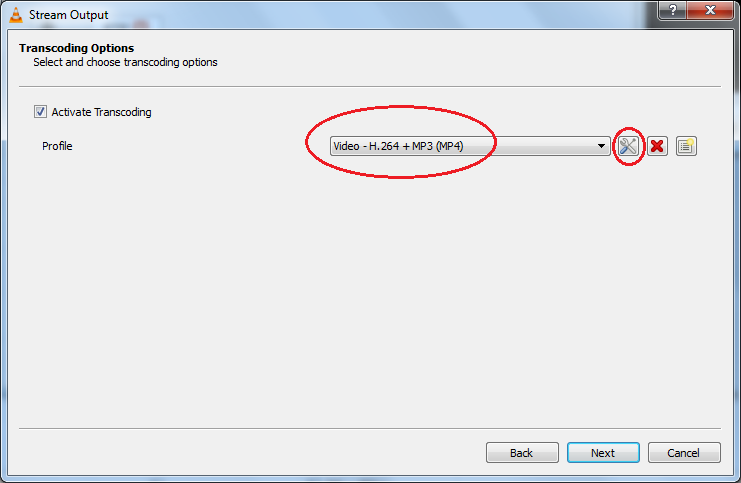
6.       Select the “Video – H.264 + MP3 (MP4)” profile and click the edit button.

vlc05

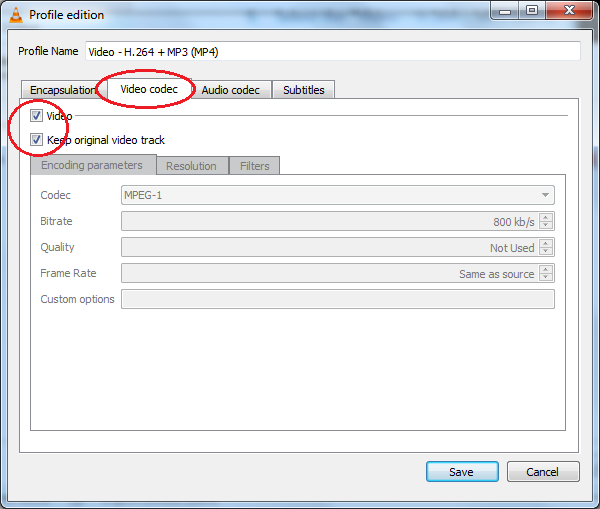
 7.       In the Encapsulation tab, accept the default MP4/MOV selection. In the Video Codec tab, select the “Video” and “Keep original video track”. The latter will disable transcoding and require significantly lesser CPU resources.

vlc06

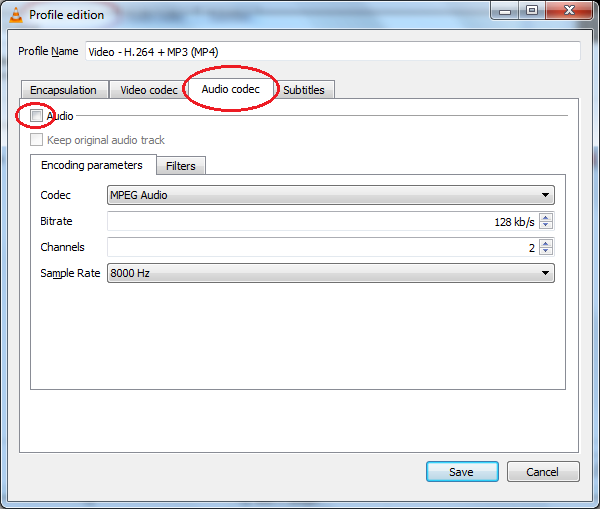
8.       In the Audio Codec tab, uncheck “Audio” to disable streaming the audio track. Similarly the Subtitles track should be disabled. Click “Save”.

vlc07

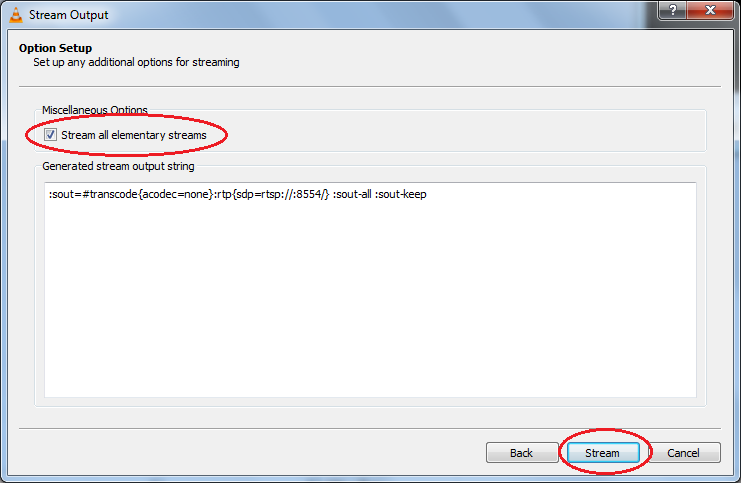
 9.       Back at the Stream Output dialog window, click “Next”. In the Option Setup step, enable “Stream all elementary streams”.

vlc08 

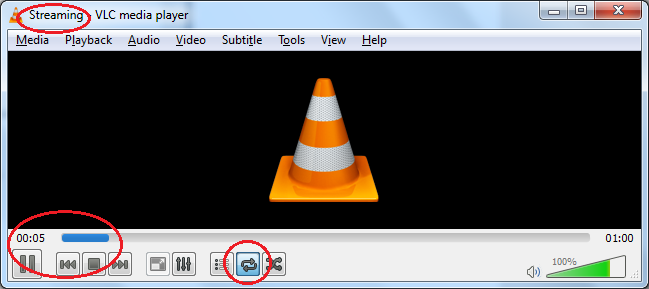
10.   Click “Stream” to start the RTSP streaming. If you need to simulate a continuous video stream, enable repeat/loop.

vlc09

11.   You may launch another instance of VLC player to verify the RTSP streaming. Select Media | Open Network Stream… and specify the RTSP URL.


The Command Line Way

1.       Launch a command prompt and navigate to the VLC installed folder.

vlc10

 2.       Launch VLC streaming with the following command,

vlc.exe -I dummy –dummy-quiet -vvv –loop “<full path to video file, including the file extension>” –sout=”#transcode{acodec=none}:rtp{sdp=rtsp://:8554/}” –sout-keep –sout-all

 3.       The above command should return immediately. Launch a new VLC GUI instance, select Media | Open Network Stream… and specify the RTSP URL (rtsp://localhost:/8554/) and verify the video streaming works.

   4.       Some notable command line arguments affect how the VLC streaming instance behaves:

  • ‘-I dummy –dummy-quiet’ allows VLC to run without showing the GUI
  • Replace <full path to video file, including the file extension> with the actual video file path. The pair of double quotes that encapsulates the file path is required.
  • ‘acodec=none’ disables streaming the audio stream
  • The command line arguments need to be typed exactly as above without missing the required double quotes and whitespaces; VLC in command line mode is rather intolerant in this aspect. 


Generating more than one RTSP Stream

You can generate more than one RTSP stream by repeating the above steps. However each stream needs to use a unique port number. For instance if your first stream uses Port 8554, the second stream can use Port 8555 and so on.


Possible Problems and Solutions

  • My video file is not H.264 encoded

You may need to turn on transcoding in Step 7 of the GUI method. Uncheck ‘Keep original video track’ and configure the encoding settings.

  • I can’t get it to work

Start with VLC Version 2.2.6 rather than the latest Version 3.x editions.

  • I can receive the RTSP streams on the local machine, but not from a remote machine. My local Windows Firewall has already been disabled.

Try VLC Version 1.1.9

  • The auto-repeat loop doesn’t work or stops randomly.

Try VLC Version 1.1.9


A Network Equipment Monitoring System

This post is about a rudimentary network equipment monitoring system that is based on the C# Message Bus Library published in the previous post. It consists of a server console app that periodically pings a list of network equipment of your choice and sends the reachability status to all connected client apps. The publish-subscribe messaging pattern delivers two useful features: all connected clients receive live equipment reachability statuses in real time, and any modification to the equipment configuration is automatically updated on connected clients without requiring the user to restart the app or manually reload the configuration. The download link to the Visual Studio solution is here.

The NetworkEqptMonitorServer project contains the server code. It loads the equipment list from an XML configuration file (C:\ProgramData\NetworkEqptMonitor\NetworkEqptMonitor.cfg) and publishes the inventory on the message bus. The client app (NetworkEqptMonitorClient project) subscribes to the equipment inventory topic and displays the list of monitored equipment on the GUI.

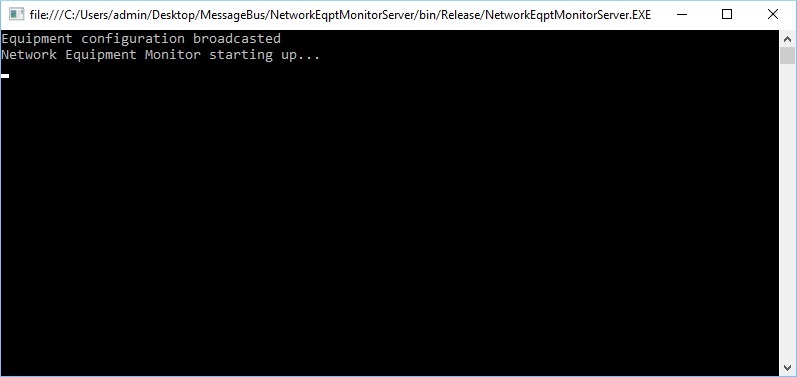
NetworkEqptMonitorServer
The Server App

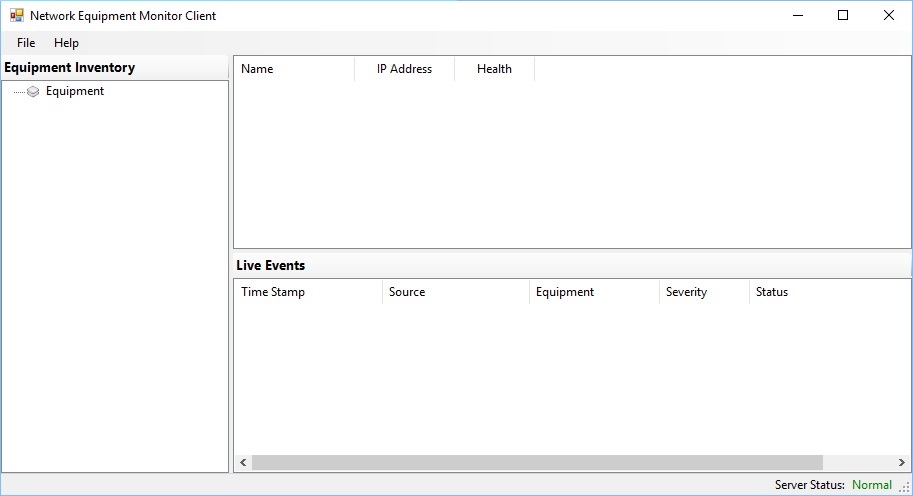
NetworkEqptMonitorClient
The Client GUI

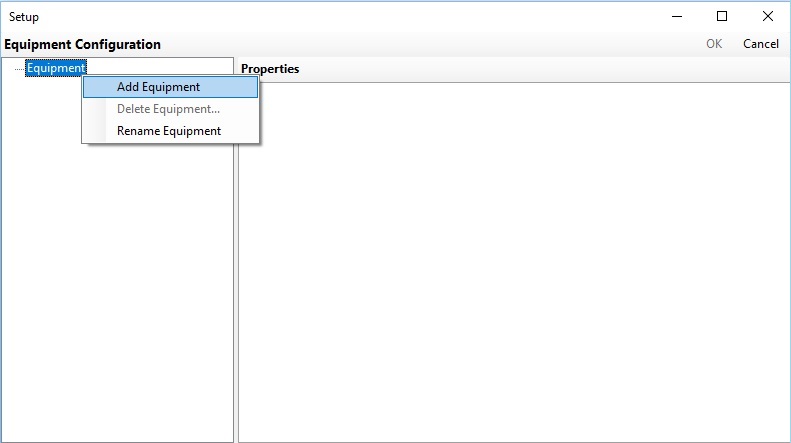
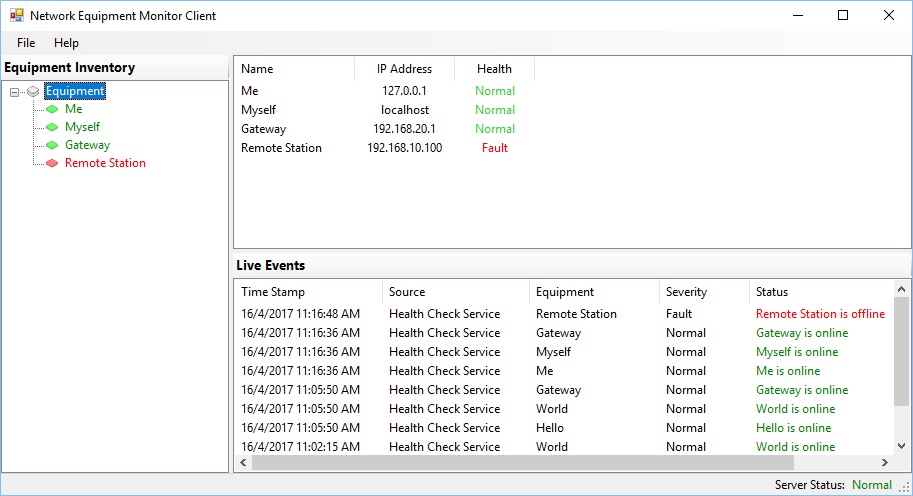
The equipment inventory is empty when the app is initially started. On the client app, select File | Setup… to bring up the configuration dialog window. Right-click the Equipment tree view and select ‘Add Equipment’ to start adding entries to the inventory. When done, click the OK button to save the configuration. The server app picks up the new configuration and starts pinging the equipment every 15 seconds.

Setup
Adding a network equipment in the Setup dialog window

ClientInAction.jpg
The client app in action after adding some network equipment entries

You can run multiple instances of the Client App on the same or different machine(s). Before running the client app on a different machine, be sure to specify the IP address of the ActiveMQ message bus broker in the NmsServerIpAddress and MessageBusBrokerUri fields of the XML configuration file (C:\ProgramData\NetworkEqptMonitor\NetworkEqptMonitor.cfg).

<?xml version="1.0" encoding="utf-8"?>
<SystemConfiguration xmlns:xsi="http://www.w3.org/2001/XMLSchema-instance" xmlns:xsd="http://www.w3.org/2001/XMLSchema">
  <ConfigurationFileName>NetworkEqptMonitor</ConfigurationFileName>
  <NmsServerIpAddress>127.0.0.1</NmsServerIpAddress>
  <MessageBusBrokerUri>failover:(tcp://localhost:61616)?transport.timeout=3000</MessageBusBrokerUri>
  <EquipmentHealthCheckInterval>15</EquipmentHealthCheckInterval>
...

Note the subscription to the Equipment Configuration topic in the client app makes use of the retroactive consumer feature of ActiveMQ, i.e. at the point of registering the subscription the message bus needs to deliver the last published equipment configuration to the client app. The setting for this feature, called the Subscription Recovery Policy in ActiveMQ, isn’t enabled by default. The consequence is when the client app is started it doesn’t get the equipment inventory, not until the server app publishes an update to the equipment inventory topic. Fortunately enabling the Subscription Recovery Policy is straight-forward: just add a subscriptionRecoveryPolicy setting to ActiveMQ’s conf\activemq.xml file and restart the ActiveMQ process or service.

<destinationPolicy>
  <policyMap>
    <policyEntries>
      <policyEntry topic=">" >
      <!-- The constantPendingMessageLimitStrategy is used to prevent
           slow topic consumers to block producers and affect other consumers
           by limiting the number of messages that are retained
           For more information, see:
           http://activemq.apache.org/slow-consumer-handling.html
      -->
        <pendingMessageLimitStrategy>
          <constantPendingMessageLimitStrategy limit="1000"/>
        </pendingMessageLimitStrategy>
        <subscriptionRecoveryPolicy>
          <lastImageSubscriptionRecoveryPolicy/>
        </subscriptionRecoveryPolicy>
      </policyEntry>
    </policyEntries>
  </policyMap>
</destinationPolicy>

The Network Equipment Monitoring System is rudimentary because, as you would probably have noticed, it’s missing key features such as events logging and recall, alarm triggering, SNMP monitoring, user access control and [name your required feature here]. However it’s really meant to illustrate the convenience of using the pub/sub messaging pattern in such a use case rather than attempting to deliver a full-fledge, operation-ready software utility.

C# Publish-Subscribe Message Bus Library

I’m somewhat a huge fan of the publish-subscribe (a.k.a. observer) messaging pattern. It’s a design approach I often turn to whenever a need arises to deliver software solutions requiring real-time updates to multiple client users. A Pub/Sub message bus elegantly deals with several tricky situations commonly encountered in these use cases,

Problem Statement How Pub/Sub Deals with Problem
Configuration changes made on the server are not automatically propagated to connected client nodes. Users at client nodes need to perform a manual refresh to retrieve the updated configuration. Configuration updates are automatically pushed (published) to client nodes (subscribers) without user intervention.
For real-time information updates, the server requires a mechanism to keep track of connected clients and to handle information dissemination. The Pub/Sub broker deals with the information updates automatically and reliably, allowing the server code base to focus on handling business logic.

On the other hand the Pub/Sub messaging pattern is not a silver bullet for all client-server software use cases. For instance for one-to-one transactions, such as client to server updates requiring guaranteed delivery, the message queue might be a better fit than the message bus.

Since I was using more and more of this design pattern, I started to look for a pub/sub framework that offers fault-tolerant capabilities for mission-critical solutions. A couple of years ago I came across the Apache ActiveMQ open source project. Although it is based on the Java Message Service (JMS) framework, there is a DotNet interface library for it (the ActiveMQ NMS API).  The Message Bus C# library described in this article is an interface class library that encapsulates the basic connect, disconnect, publish, subscribe and publish update functionalities of ActiveMQ though NMS. You can download the source code of the Message Bus C# library here.

public interface IMessageBus : IDisposable
{
  string BrokerUri { get; set; }
  string ClientId { get; set; }

  bool Connect();
  bool Disconnect();
  bool Publish(Topic topic);
  bool UnPublish(Topic topic);
  bool Subscribe(Topic topic, bool getLatestTopicValue = false);
  bool UnSubscribe(Topic topic);
  bool PublishUpdate(Topic topic);

  event EventHandler SubscriptionUpdateEvent;
  event EventHandler ConnectionExceptionEvent;
}

Connection to the message bus is established via the TopicConnectionFactory class. At this moment only the ActiveMQ message bus type is supported. Wrappers to other message bus frameworks, such as the more recent Apache Kafka, can be added through the IMessageBus interface class and handled in the constructor of the factory class.

enum MessageBusType
{
  Undefined,
  ActiveMQ
}

IMessageBus _MessageBus = null;

public TopicConnectionFactory(string brokerUri, string clientId,   
  MessageBusType messageBusType)
{
  if (string.IsNullOrEmpty(brokerUri))
    throw new ArgumentNullException("Invalid broker uri");

  switch (messageBusType)
  {
    case MessageBusType.ActiveMQ:
      _MessageBus = new ActiveMQBus(brokerUri, clientId);
      _MessageBus.SubscriptionUpdateEvent += MessageBus_SubscriptionUpdateEvent;
      _MessageBus.ConnectionExceptionEvent += MessageBus_ConnectionExceptionEvent;
      break;

    default:
      throw new ArgumentException("Do not know how to handle message bus of the type " + messageBusType.ToString());
  }
}


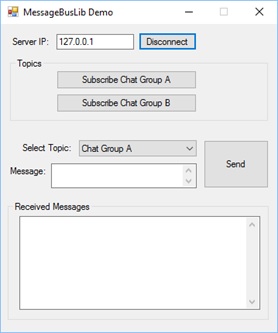
The MessageBusLibDemo project demonstrates the use of the MessageBusLib in the form of a simple text chat client. The Message Send button illustrates the publish operation, while the ‘Subscribe to chat group’ button illustrates the subscribe operation.

MessageBusLibDemo 

For the MessageBusLibDemo app to work, make sure you have installed ActiveMQ and the ActiveMQ service is running. If you encounter the following error when attempting to start ActiveMQ (as I did),

  Error occurred during initialization of VM 
  Could not reserve enough space for object heap

Modify the configuration line containing

set ACTIVEMQ_OPTS=-Xms1G –Xmx1G

in bin\activemq.bat to

set ACTIVEMQ_OPTS=-Xms512M -Xmx512M

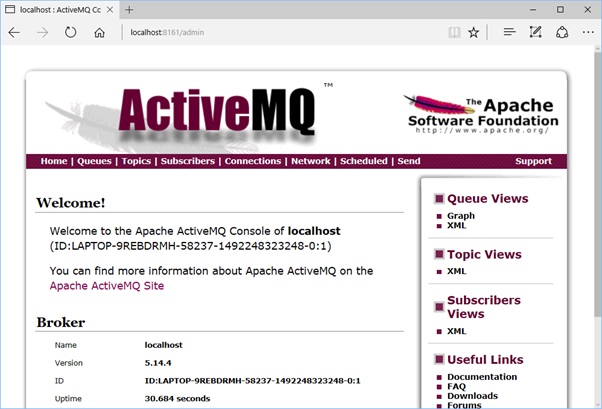
A quick test to determine if ActiveMQ is running is to launch a web browser and point it at the ActiveMQ web console (http://127.0.0.1:8161/admin/). The default login is ‘admin’ and password is ‘admin’. Note ActiveMQ requires the Java runtime. It is also possible to configure ActiveMQ to run as a Windows Service.

 ActiveMQ_WebConsole

Although the content type of the message topics is limited to text, class objects can also be distributed on the message bus via XML serialization. The next post illustrates this by using the message bus library to implement a rudimentary network equipment health monitoring system comprising one server and multiple client nodes.

Download

Source code of MessageBusLib

Raspberry Pi GPIO Data Logger

Recently my colleagues at work asked if I could help provide a quick solution for logging the relay output states of some laser scanners that were being evaluated as part of a perimeter intrusion detection solution. I had some spare Raspberry Pi boards lying around, so a simple data logger was quickly constructed using a Raspberry Pi Model B.

Technical Requirements

The high level requirements for the data logger were,

  • 8 digital inputs (wet contacts)
  • Provides a log of all digital input state transitions (rising and falling edges) and the corresponding event timestamps
  • Provides a log of the ambient temperature inside the outdoor enclosure that will house the data logger and other electrical components.
  • Operates off DC 12V supply rail.


Electronics Design & Construction

The digital inputs to the data logger were wet contacts toggling between 12V DC and 0V, whereas the Raspberry Pi GPIO pins are 3.3V. The readily available PC817 series optoisolators were selected for the digital input interface.

Data Logger
Complete electronics schematic for the Pi Data Logger

The electronics bill of material for the data logger:

Reference

Value

Description

Online Source

C1

100uF 10V

Electrolytic

C2

0.1uF

Ceramic

D1

1N4001

D2

P6KE30CA

TVS Diode

 Ebay link

D3

3mm LED

Status LED

IC1

DS18B20

Temperature Probe

 Ebay link

M1

DC-DC_PSU

12VDC to 5VDC

 Ebay link

M2

DS3231

RTC Module

 Ebay link

P1 – P8

P9

Raspberry PI GPIO 26-Pin Header

P10

R1 – R9

1K5

R10 – R16

3K3

R17

4K7

R18

100R

U1 – U8

PC817

1-channel Optoisolator

 Ebay link

I had success using DS18b20 temperature sensors from Maxim in the past; as long as you do not need more than a measurement every second or two it should work reliably. The TVS diode was included for rudimentary lightning surge protection since the data logger will be deployed outdoors, albeit it will be installed inside an environmental enclosure. The 1N4001 provides protection from reversed supply connection.

The DC-DC switchmode power supply provides a stable 5V DC supply to the Pi. If you plan to use the same PSU module, beware the factory-default output is around 10~11V. There is a trim pot to adjust that down to 5V.

Note the digital inputs (P1 to P8) shown in the schematic diagram are wired for dry-contact operation. For wet-contact connections the 12V connection should be removed, since the 12V source to drive the optoisolator LED would come from the external interface. Note for this to work, the data logger circuit and the external interface must share a common ground.

The series resistors to the optoisolator inputs were determined from the PC817 datasheet, selecting a forward current that will ensure the output transistor is driven to saturation.

PC817

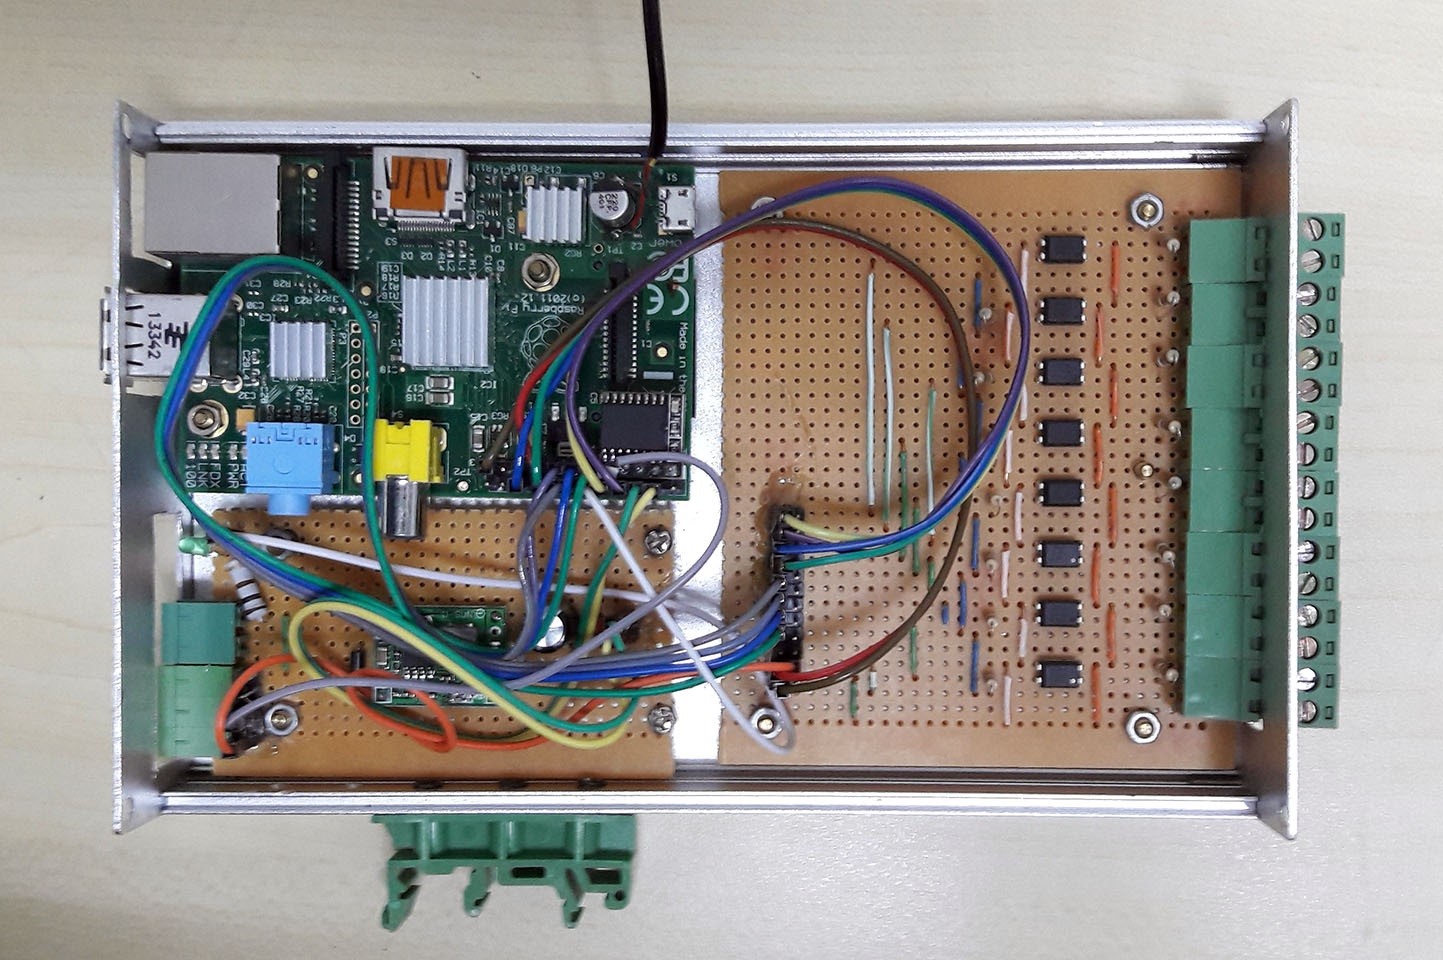
As it was a quick, one-off construction job the electronics hardware was soldered onto strip boards. I had an aluminum chassis left over from a previous microcontroller prototype build and it was a good candidate for reuse.

RPi Data Logger PCAs
Internals of the RPi Data Logger


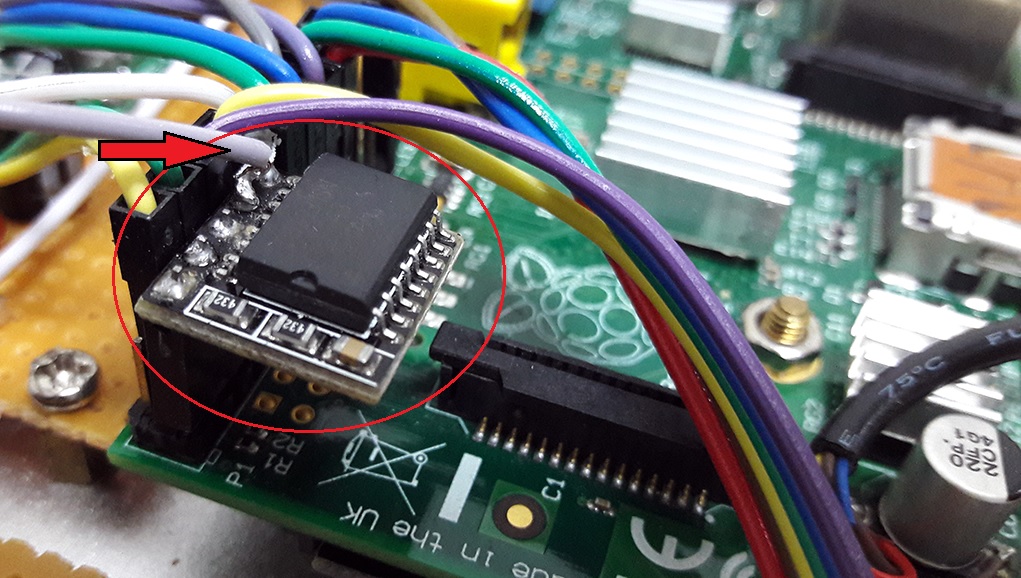
The DS3231 RTC module was designed to be plugged directly into pins 1, 3, 5, 7 & 9 of the Raspberry Pi GPIO header. Pin 7 (GPIO 4) is not used by the RTC module (marked as NC on the RTC module); however a connection to the data pin of the DS18b20 temperature probe had to be soldered to that NC pin on the RTC module to form a pass-through. Not an elegant design, perhaps alright for a one-off quick construction job.

RTC Module on RPi
The RTC Module mounted on RPi GPIO Pins #1, 3, 5, 7, 9. The connection to the DS18b20 data pin is soldered to the 4th pin of the RTC.

Raspian Configuration

The stock Raspian Linux OS required the following modifications to work with the temperature probe and RTC.

1. Enable I2C automatic loading in raspi-config | Advanced Options.

2.  /boot/config.txt

    Add these lines to the end of the file,

dtparam=spi=on
dtparam=i2c_arm=on
dtoverlay=i2c-rtc,ds3231
dtoverlay=w1-gpio

3.  /etc/modules

Add these lines to the end of the file,

snd-bcm2835


Data Logger Software

Python was an easy choice for a quick prototyping job on the Raspberry Pi. The most intuitive approach was to configure the eight GPIO pins as inputs and set them up for interrupt triggering, with a callback function that will record the new digital input state along with a timestamp. This naïve approach would work, except we quickly hit a stumbling block. We observed if two or more inputs changed states at around the same time the interrupt callback would frequently fail to occur for the later triggers. The missed events were an immediate show-stopper, indicating the Python-Raspberry Pi combo might not be suitable for serious more-than-casual real-time control tasks.

Fortunately there was a grace-saving workaround. Somehow the GPIO interrupt callback started to behave nicely if the Python script monitors just a single input. Thereafter replicate the script for the other seven inputs, run them in separate processes from a bash script and finally the output triggers from the laser scanners were all nicely detected and logged. The following code block illustrates the Python script for Channel 1. To modify the script for another channel simply update the ‘activechannel’ variable assignment in Line 17.

#!/usr/bin/env python2.7
import RPi.GPIO as GPIO
import time
from datetime import datetime

GPIO.setmode(GPIO.BCM)

DI01 = 17
DI02 = 27
DI03 = 22
DI04 = 23
DI05 = 24
DI06 = 25
DI07 = 14
DI08 = 15

activechannel = DI01

iomap = {'17':'1', '27':'2', '22':'3', '23':'4', '24':'5', '25':'6', '14':'7', '15':'8'}
GPIO.setup(activechannel, GPIO.IN)
logdir = "/home/pi/static/"

def logToFile(filename, content):
  with open(logdir + filename, "a") as logfile:
  logfile.write(content + "\n")

def my_callback(channel):
  time.sleep(0.1)
  rawstate = 1 - GPIO.input(activechannel)
  channelname = iomap[str(channel)]
  timestamp = datetime.now().strftime("%Y-%m-%d %H:%M:%S")
  record = timestamp + "," + channelname + "," + str(rawstate)
  print record
  logToFile("logs.csv", record)

GPIO.add_event_detect(activechannel, GPIO.BOTH, callback=my_callback, bouncetime=300)

try:
  while (True):
  time.sleep(1)

except KeyboardInterrupt:
  GPIO.cleanup() # clean up GPIO on CTRL+C exit
  GPIO.cleanup() # clean up GPIO on normal exit

A simple web service was built using Python Flask to provide quick access to the data logger telemetry records via a web browser. Despite using meta headers to prevent web browsers from caching the log files, subsequent log file downloads seemed to deliver the older version of the logs (as tested on IE). The quick workaround was to clear the browser cache, refresh the web page and click the download links again.

from flask import Flask
import RPi.GPIO as GPIO

app = Flask(__name__)
GPIO.setmode(GPIO.BCM)

pins = {
 17 : {'name' : 'DI 1', 'state' : GPIO.LOW},
 27 : {'name' : 'DI 2', 'state' : GPIO.LOW},
 22 : {'name' : 'DI 3', 'state' : GPIO.LOW},
 23 : {'name' : 'DI 4', 'state' : GPIO.LOW},
 24 : {'name' : 'DI 5', 'state' : GPIO.LOW},
 25 : {'name' : 'DI 6', 'state' : GPIO.LOW},
 14 : {'name' : 'DI 7', 'state' : GPIO.LOW},
 15 : {'name' : 'DI 8', 'state' : GPIO.LOW}
 }
for pin in pins:
 GPIO.setup(pin, GPIO.IN)

@app.route('/')
def index():
 return "<meta http-equiv=\"cache-control\" content=\"max-age=0\" /> <meta http-equiv=\"cache-control\" content=\"no-cache, no-store, must-revalidate\" /> 
<meta http-equiv=\"expires\" content=\"0\" /> <meta http-equiv=\"expires\" content=\"Tue, 01 Jan 1980 1:00:00 GMT\" /> 
<meta http-equiv=\"pragma\" content=\"no-cache\" />" + "<body><p><a href='static/logs.csv'>Download IO Logs</a></p><p><a href='static/temperature.csv'>Download Temperature Logs</a></p><br><p><a href='./status'>View Current Input States</a></p></body>"

@app.route('/status')
def status():
 result = "<meta http-equiv=\"cache-control\" content=\"max-age=0\" /> <meta http-equiv=\"cache-control\" content=\"no-cache\" /> <meta http-equiv=\"expires\" content=\"0\" /> <meta http-equiv=\"expires\" content=\"Tue, 01 Jan 1980 1:00:00 GMT\" /> <meta http-equiv=\"pragma\" content=\"no-cache\" />" + "<body><h1>Input States</h1>"
 tablecontent = "<table><tr><td>Channel</td><td>State</td></tr>"
 sortedinputs = sorted(pins.items(), key=lambda x: x[1]['name'])
 for pin in sortedinputs:
 # A side requirement from my colleagues was to invert all channels except #3 & #6
 if pin[1]['name'] == 'DI 3' or pin[1]['name'] == 'DI 6':
 pin[1]['state'] = GPIO.input(pin[0])
 else:
 pin[1]['state'] = 1 - GPIO.input(pin[0])
 row = "<tr><td>" + str(pin[1]['name']) + "</td><td>" + str(pin[1]['state']) + "</td></tr>" 
 tablecontent = tablecontent + row
 tablecontent = tablecontent + "</table>"
 result = result + tablecontent + "</body>"
 return result

if __name__ == '__main__':
 app.run(host='0.0.0.0', port=80)


A separate Python script logs the temperature measurements. To provide a visual indication that the data logger is functioning normally, the same script also blinks the status LED at around 1 Hz.

#!/usr/bin/env python2.7
import os
import glob
import time
import RPi.GPIO as GPIO
from datetime import datetime

LED = 18
GPIO.setmode(GPIO.BCM)
GPIO.setup(LED, GPIO.OUT)

os.system('modprobe w1-gpio')
os.system('modprobe w1-therm')

base_dir = "/sys/bus/w1/devices/"
device_folder = glob.glob(base_dir + '28*')[0]
device_file = device_folder + '/w1_slave'

def read_temp_raw():
  f = open(device_file, 'r')
  lines = f.readlines()
  f.close()
  return lines

def read_temp():
  lines = read_temp_raw()
  while lines[0].strip()[-3:] != 'YES':
    time.sleep(0.2)
    lines = read_temp_raw()
  equals_pos = lines[1].find('t=')
  if equals_pos != -1:
    temp_string = lines[1][equals_pos+2:]
    temp_c = float(temp_string) / 1000.0
    return temp_c

logdir = "/home/pi/static/"
def logToFile(filename, content):
  with open(logdir + filename, "a") as logfile:
    logfile.write(content + "\n")

try:
  while (True):
    for i in range(0, 29):
      time.sleep(0.5)
      if i % 2 == 0:
        GPIO.output(LED, GPIO.HIGH)
      else:
        GPIO.output(LED, GPIO.LOW)
    temperature = str(read_temp())
    timestamp = datetime.now().strftime("%Y-%m-%d %H:%M:%S")
    record = timestamp + ",T," + temperature
    print(record)
    logToFile("temperature.csv", record)

except KeyboardInterrupt:
    GPIO.output(LED, GPIO.HIGH)
    GPIO.cleanup()
GPIO.output(LED, GPIO.HIGH)
GPIO.cleanup()

A bash script, startlogger.sh, runs all the Python scripts. The following lines were added to the end of /etc/rc.local to automatically launch the bash script when the Pi powers up.

hwclock -s
/home/pi/startlogger.sh &

The content of startlogger.sh,

#!/bin/bash
python /home/pi/d1.py &
python /home/pi/d2.py &
python /home/pi/d3.py &
python /home/pi/d4.py &
python /home/pi/d5.py &
python /home/pi/d6.py &
python /home/pi/d7.py &
python /home/pi/d8.py &
python /home/pi/temperature.py &
python /home/pi/loggerweb.py &
exit 0

End Result and Conclusion

It’s been several days since handling over the data logger to my colleagues, and from what I’ve heard it’s working as intended out at the test site. The Raspberry Pi was chosen for the task as the original plan was to send the telemetry logs to a connected USB flash drive for easy data retrieval. Along the way that had evolved to providing a web page with download links for the telemetry records due to concerns with corrupting the USB drive if removed without proper dismounting. In hindsight an Arduino Uno or Mega with an SD card shield might have been a simpler endeavor, even though the opto-coupling electronics interface would still be required.

Milestone XProtect Corporate 2014 Re-installation Hints

Milestone XProtect Corporate (XPC) can be notoriously challenging to reinstall. This guide offers some suggestions to increase the success rate if you ever need to perform a reinstallation on Windows Server 2008 or 2012.

Suggested Steps

  1. Uninstall Milestone Advanced XProtect via Programs and Features in Control Panel. Select to remove all XProtect components.
  2. Delete these remnant folders
    • C:\Program Files\Milestone.
    • C:\Program Files (x86)\Milestone
    • C:\Program Files (x86)\Common\VideoOS
    • C:\ProgramData\Milestone
  3. In Server Manager, remove the IIS role entirely. Reboot Windows when prompted.
  4. After Windows has restarted, verify the IIS role is removed successfully.
  5. Launch XPC Setup to begin the reinstallation. With luck, the XPC installation should complete successfully this time.